
At U.S. Bank, we constantly monitor the global economy, financial markets and government policy in pursuit of better investment outcomes for our clients. We created the U.S. Bank Health Check to process the many pieces of information from around the world that we review each day. This proprietary tool helps us assess economic data in the United States and globally, turning statistics into discernable trends that provide greater insight into financial markets and economies worldwide, informing our investment decision-making process.
A core investment tenet at U.S. Bank is that the economy doesn’t just move in a straight line. Economies produce peaks and valleys as they heat up and cool down over time. The challenge investors face is in determining where in the economic cycle we currently stand, as most traditional measures of broad economic activity are released well after the end of the measured period. Those numbers, including measures like gross domestic product (GDP), essentially tell us more about where we've been than where we are today.
GLOBAL HEALTH CHECK
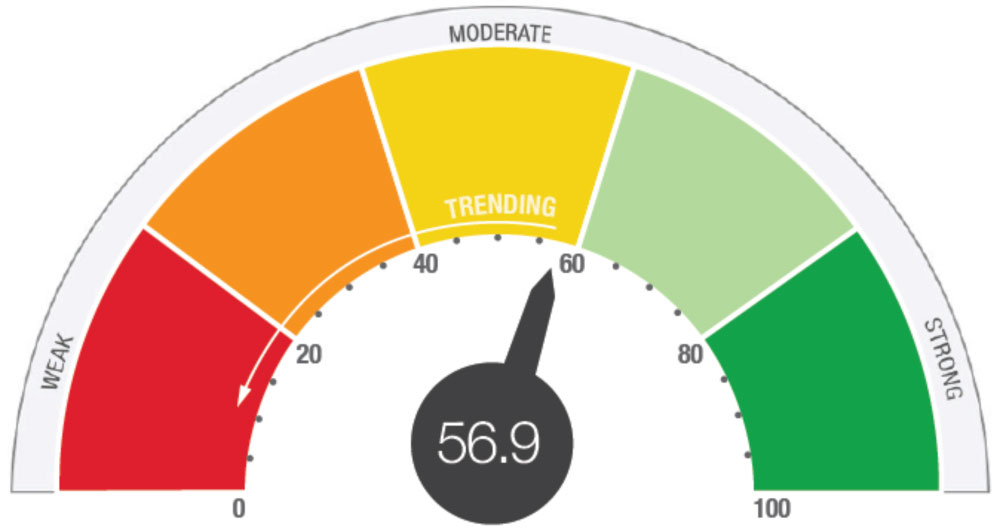
The U.S. Bank proprietary Global Health Check incorporates more than 1,000 data points — including business climate factors and economic sector categories for 22 major economies representing 80 percent of total global wealth — to reflect our view of the current strength of worldwide economic growth.
Source: U.S. Bank Asset Management Group, March 2022.
We created our proprietary Health Check to summarize economic data within an economic cycle in real time. The global Health Check incorporates more than 1,000 key indicators across 22 major economies representing more than 80 percent of the world’s total wealth. We distill this information down to one number, which allows us to more effectively assess the current state and trends of the global economy.
Our global Health Check includes the United States market, foreign developed markets (Canada, Australia, Japan, Spain, Netherlands, Switzerland, Germany, Sweden, Italy, France, U.K.) and foreign emerging markets (Mexico, China, Indonesia, Taiwan, South Korea, India, South Africa, Brazil, Turkey, Russia).
How our Health Check works
The Health Check begins with data releases across a range of economic measures, such as industrial production, housing starts and consumer confidence. Economic data series are reported in various measurements (such as a number, percent of respondents or rate of change), making direct comparisons difficult. To address these inconsistencies and obtain an accurate read, we:
Rank each data release relative to its own history on a scale of zero to 100, with zero being the worst point in history and 100 being the best.
Sort the data into 10 primary economic sectors, such as manufacturing, services, housing and labor.
Average the individual percentile scores to reach a sector level score.
Combine and average the sector scores to give an overall Health Check score for a country.
Combine individual country numbers to create global scores.
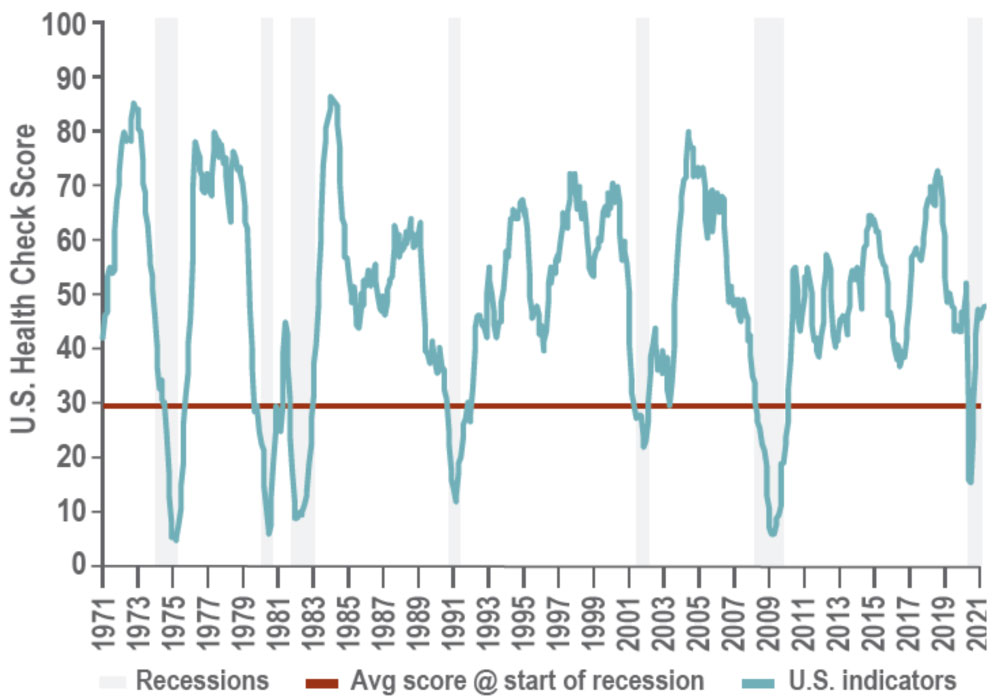
We can graph this number through time, visualizing the economic cycles. Here you can see how our Health Check scored the U.S. economy over the past 50 years, with recessions as defined by the National Bureau of Economic Research (NBER) shaded in grey:
U.S. HEALTH CHECK: 1971-2021
Source: U.S. Bank Asset Management Group, March 2022.
Health Check depicts the economy’s direction and how fast it is moving
The Health Check score is just one element in assessing the economy. Much of the movement in capital markets is a result of changes in the direction of the economy as investors try to discern whether data is trending better or worse. The combination of the economic direction trend score and the Health Check score allows us to better estimate where the economy stands within the economic cycle.
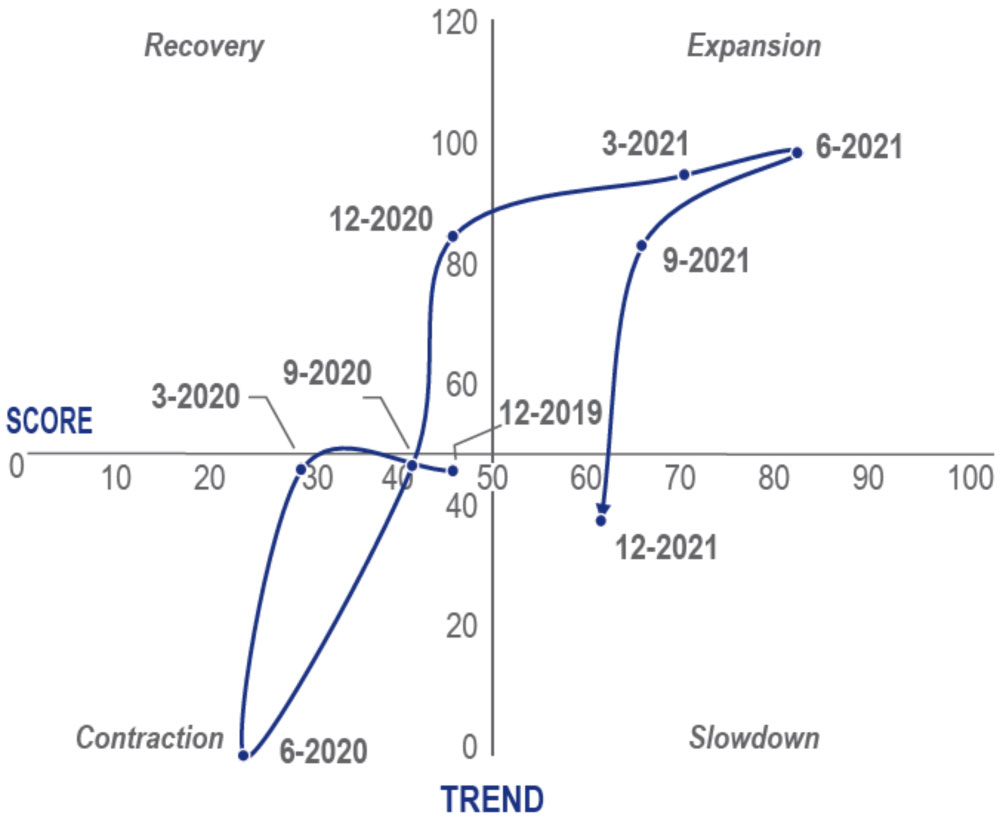
We calculate the trend by using the three-month moving average of the Health Check score and subtracting it from the 12-month moving average. A number above 50 signals that data is improving while a reading below 50 means the opposite. With both a Health Check score and a trend score, we can provide a visual representation of the current state of the economy in a quadrant format and assign a descriptive label to each quadrant. For example, a Health Check score above 50 (better than average) and a trend score also above 50 (recent data is better than past data) suggests an economy is in an expansion mode. Conversely, a Health Check score below 50 (worse than average) and a trend score below 50 (worsening data) implies an economy in a state of contraction.
The following graph shows the U.S. economy’s trend over the past year. The economy moved deep into recession early in 2020 but moved into recovery in September and has continued to improve. This coincided with equities’ outperformance compared to traditional core fixed income investments. Within equities, we saw a period of outperformance by market segments that we believe indicate economic recovery, such as mid-cap equities.
U.S. HEALTH CHECK: TREND AND SCORE 12/2019 – 12/2021
Source: U.S. Bank Asset Management Group, March 2022.
A Health Check assessment of today’s U.S. economy
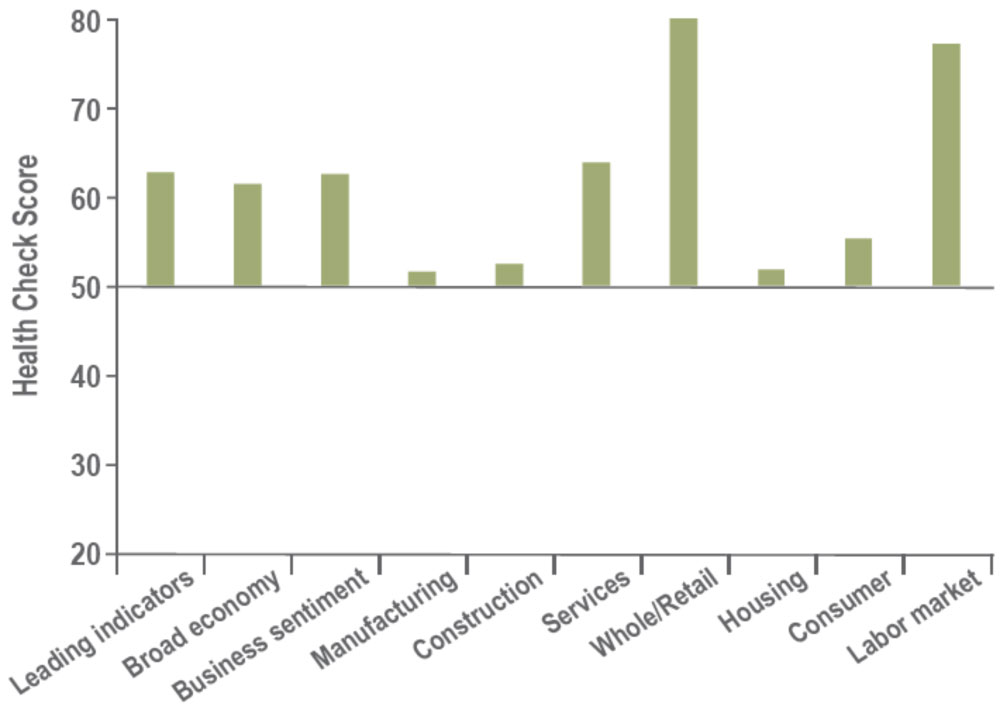
A closer look at the important components of the U.S. Health Check provides further insight into how we use the Health Check to analyze economies. We start by looking at the sector (industry) level. The following graph shows differences across various sectors of the U.S. economy as we begin 2021. The line that crosses at the 50 level indicates a “normal” level.
U.S. HEALTH CHECK: SECTOR CATEGORIES AND BUSINESS CLIMATE FACTORS
Source: U.S. Bank Asset Management Group, March 2022.
Currently, consumer sentiment (consumer spending accounts for the majority of GDP) remains subdued due to COVID-19 spread, ongoing activity restrictions and the commensurate impact on labor market conditions. However, business executives remain modestly optimistic about vaccination progress and the potential for a 2021 economic reopening. Not surprisingly, the manufacturing sector has recovered to a normal level. Meanwhile, the service sector remains impaired, with activity well below the mid-point level. The housing market continues to support the economy, bolstered by below average mortgage rates and strong demand for single family homes. Finally, leading indicators suggest the tenuous nature of the early-stage economic recovery and the importance of ongoing monetary and fiscal support.
U.S. HEALTH CHECK
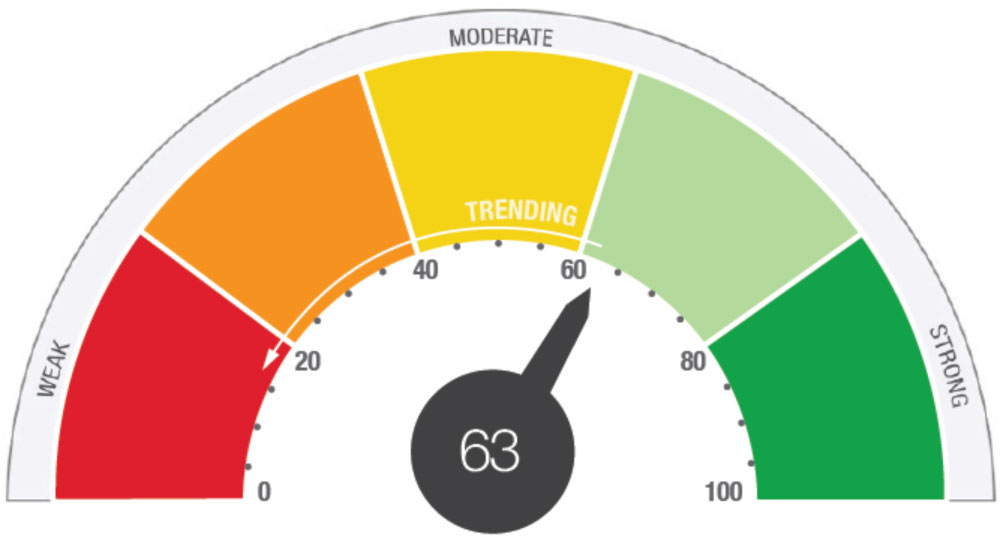
Our U.S. Health Check incorporates more than 100 data points – including business climate factors and economic sector categories – to reflect our view of the current strength of U.S. economic growth.
Source: U.S. Bank Asset Management Group, March 2022.
Conclusion
We remain committed to providing industry-leading capital market analysis aimed at enhancing outcomes for client portfolios. Tools like the U.S. Bank Health Check create a process to improve the consistency of our evaluations and provide data-driven investment strategies. If you have further questions about this information and what it may mean for your portfolio, please contact your financial professional.
This information represents the opinion of U.S. Bank Wealth Management. The views are subject to change at any time based on market or other conditions and are current as of the date indicated on the materials. The factual information provided has been obtained from sources believed to be reliable but is not guaranteed as to accuracy or completeness. U.S. Bank is not affiliated or associated with any organizations mentioned. .
Indexes shown are unmanaged and are not available for direct investment. The S&P 500 Index consists of 500 widely traded stocks that are considered to represent the performance of the U.S. stock market in general.
Tags:
Related articles

Stock market under the Biden administration
Explore how the stock market has fared so far under the Biden administration and what to expect moving forward.

Is the economy at risk of a recession?
The Federal Reserve is focused on fighting inflation with aggressive policy moves intended to slow consumer demand. Does this put the economy at risk of a recession in 2023?
